Highest score and strongest relative result did not match
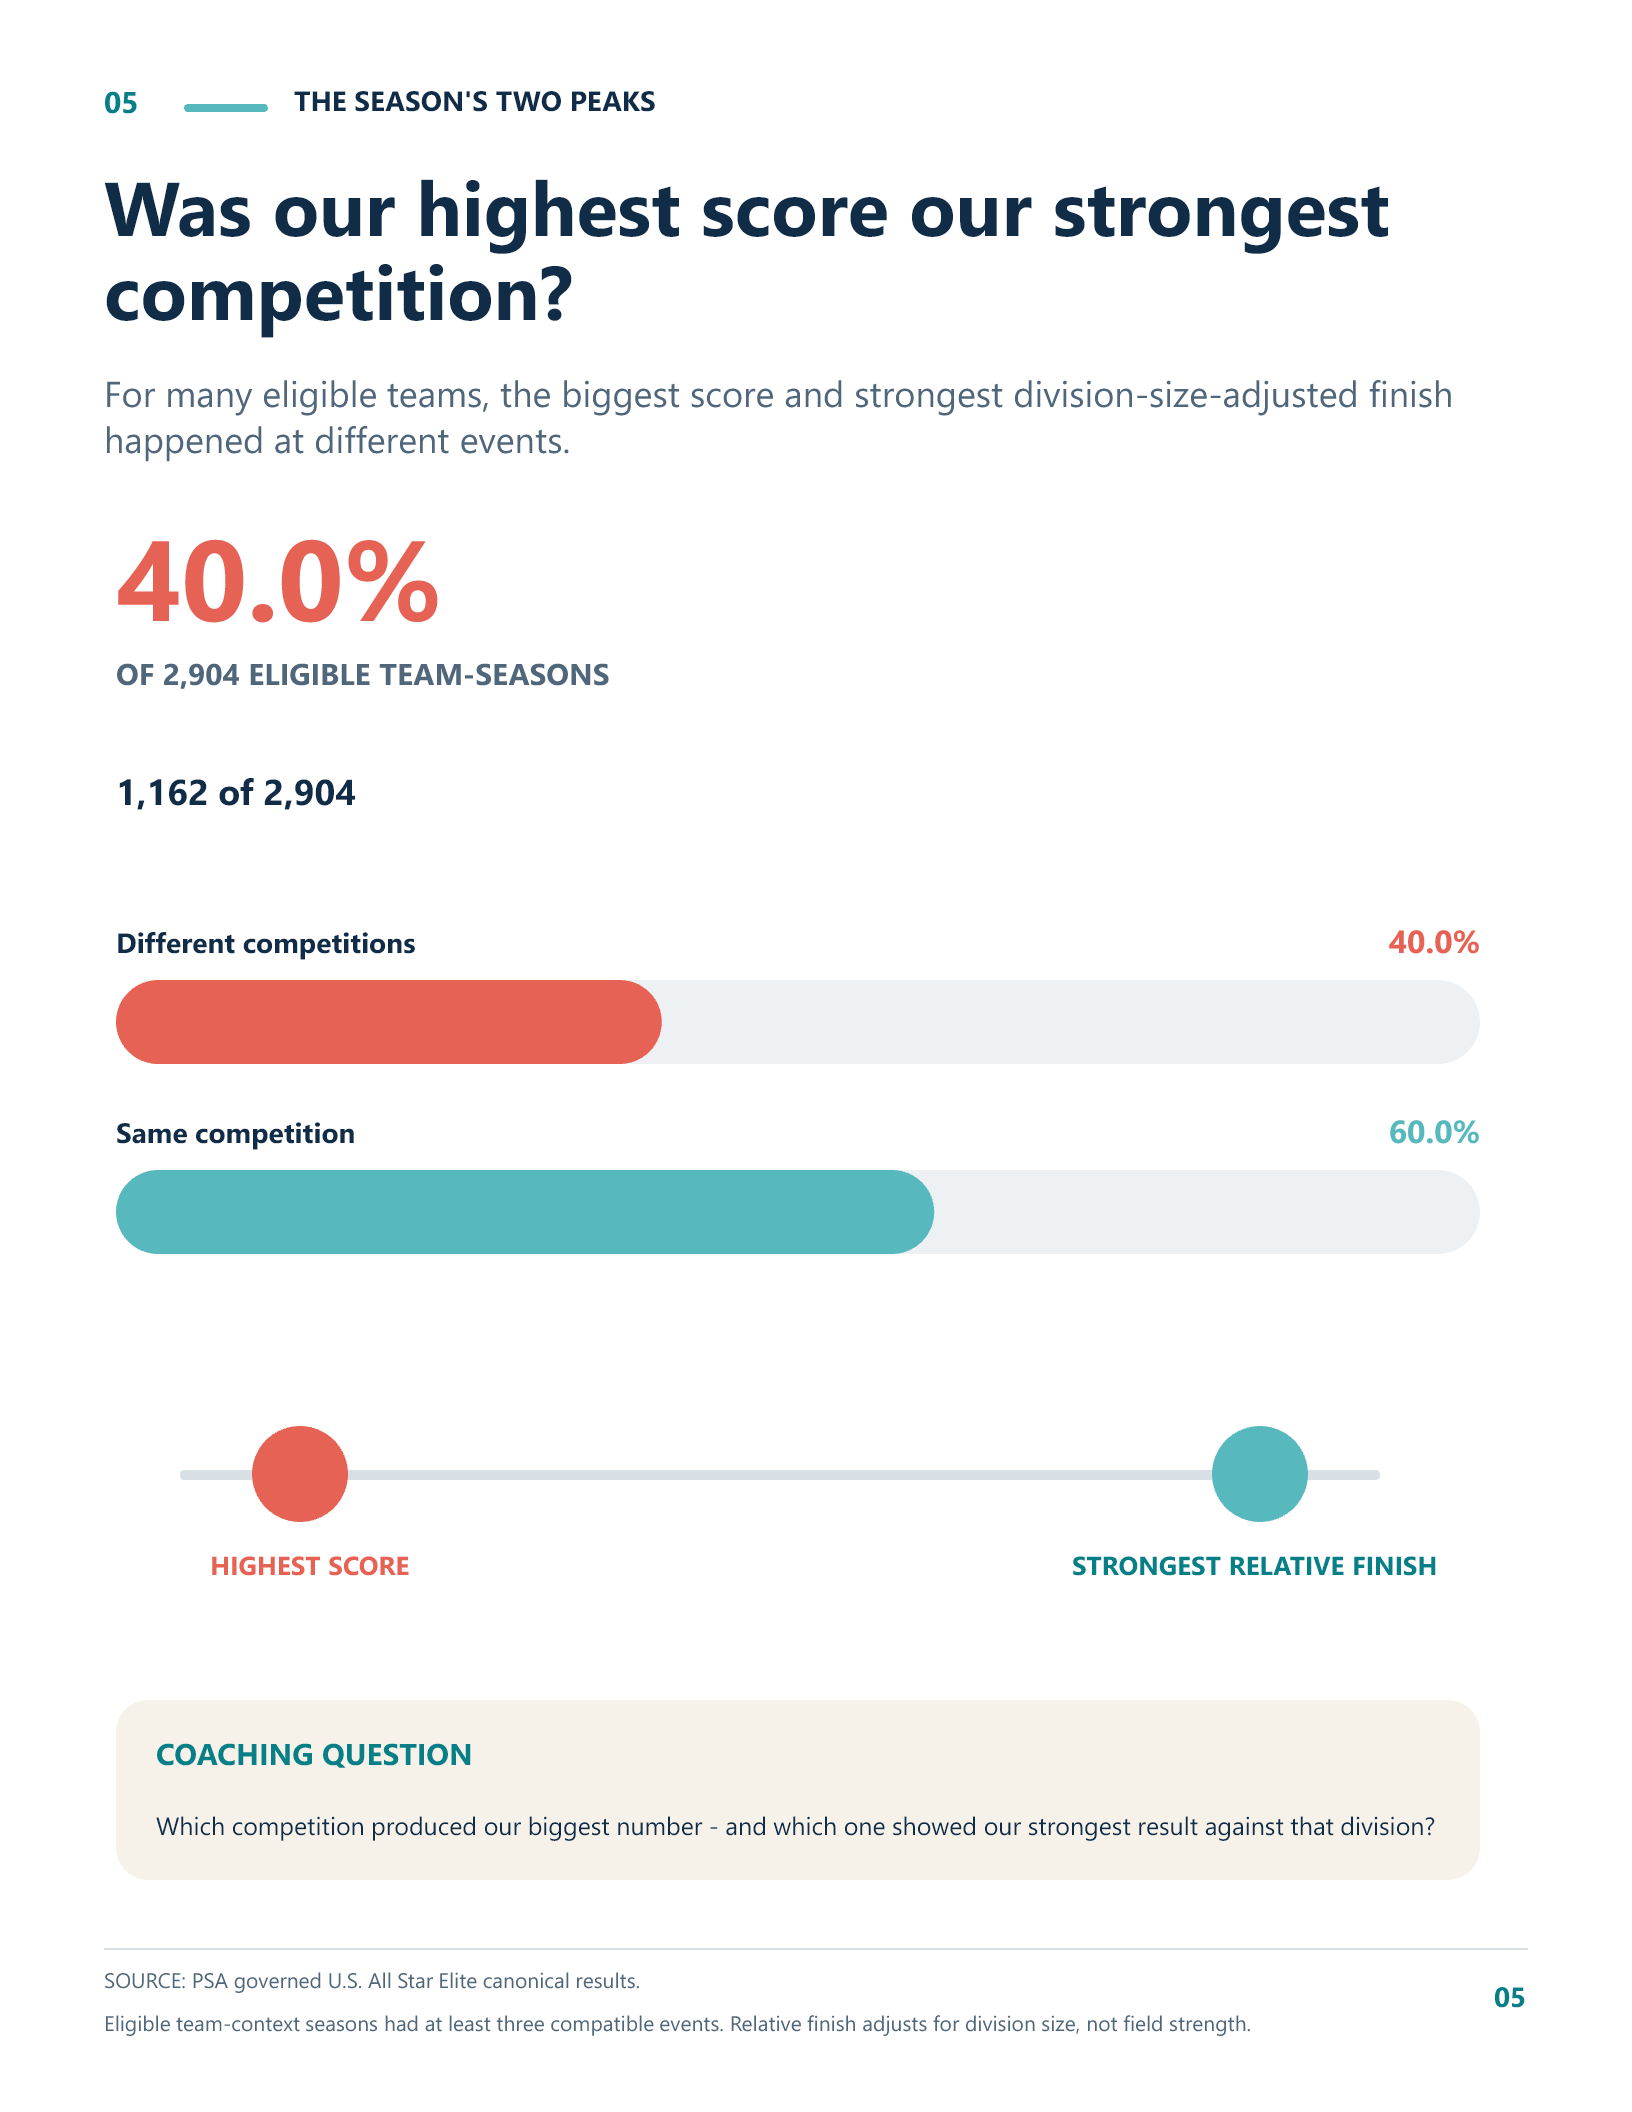
For 1,162 of 2,904 eligible Elite team-seasons, the two peaks occurred at different competitions.
Free 2025-2026 Industry Report
Governed analysis of Varsity U.S. All Star Elite competition results, built around the questions coaches ask when score and competitive context do not move together.
Send me the report
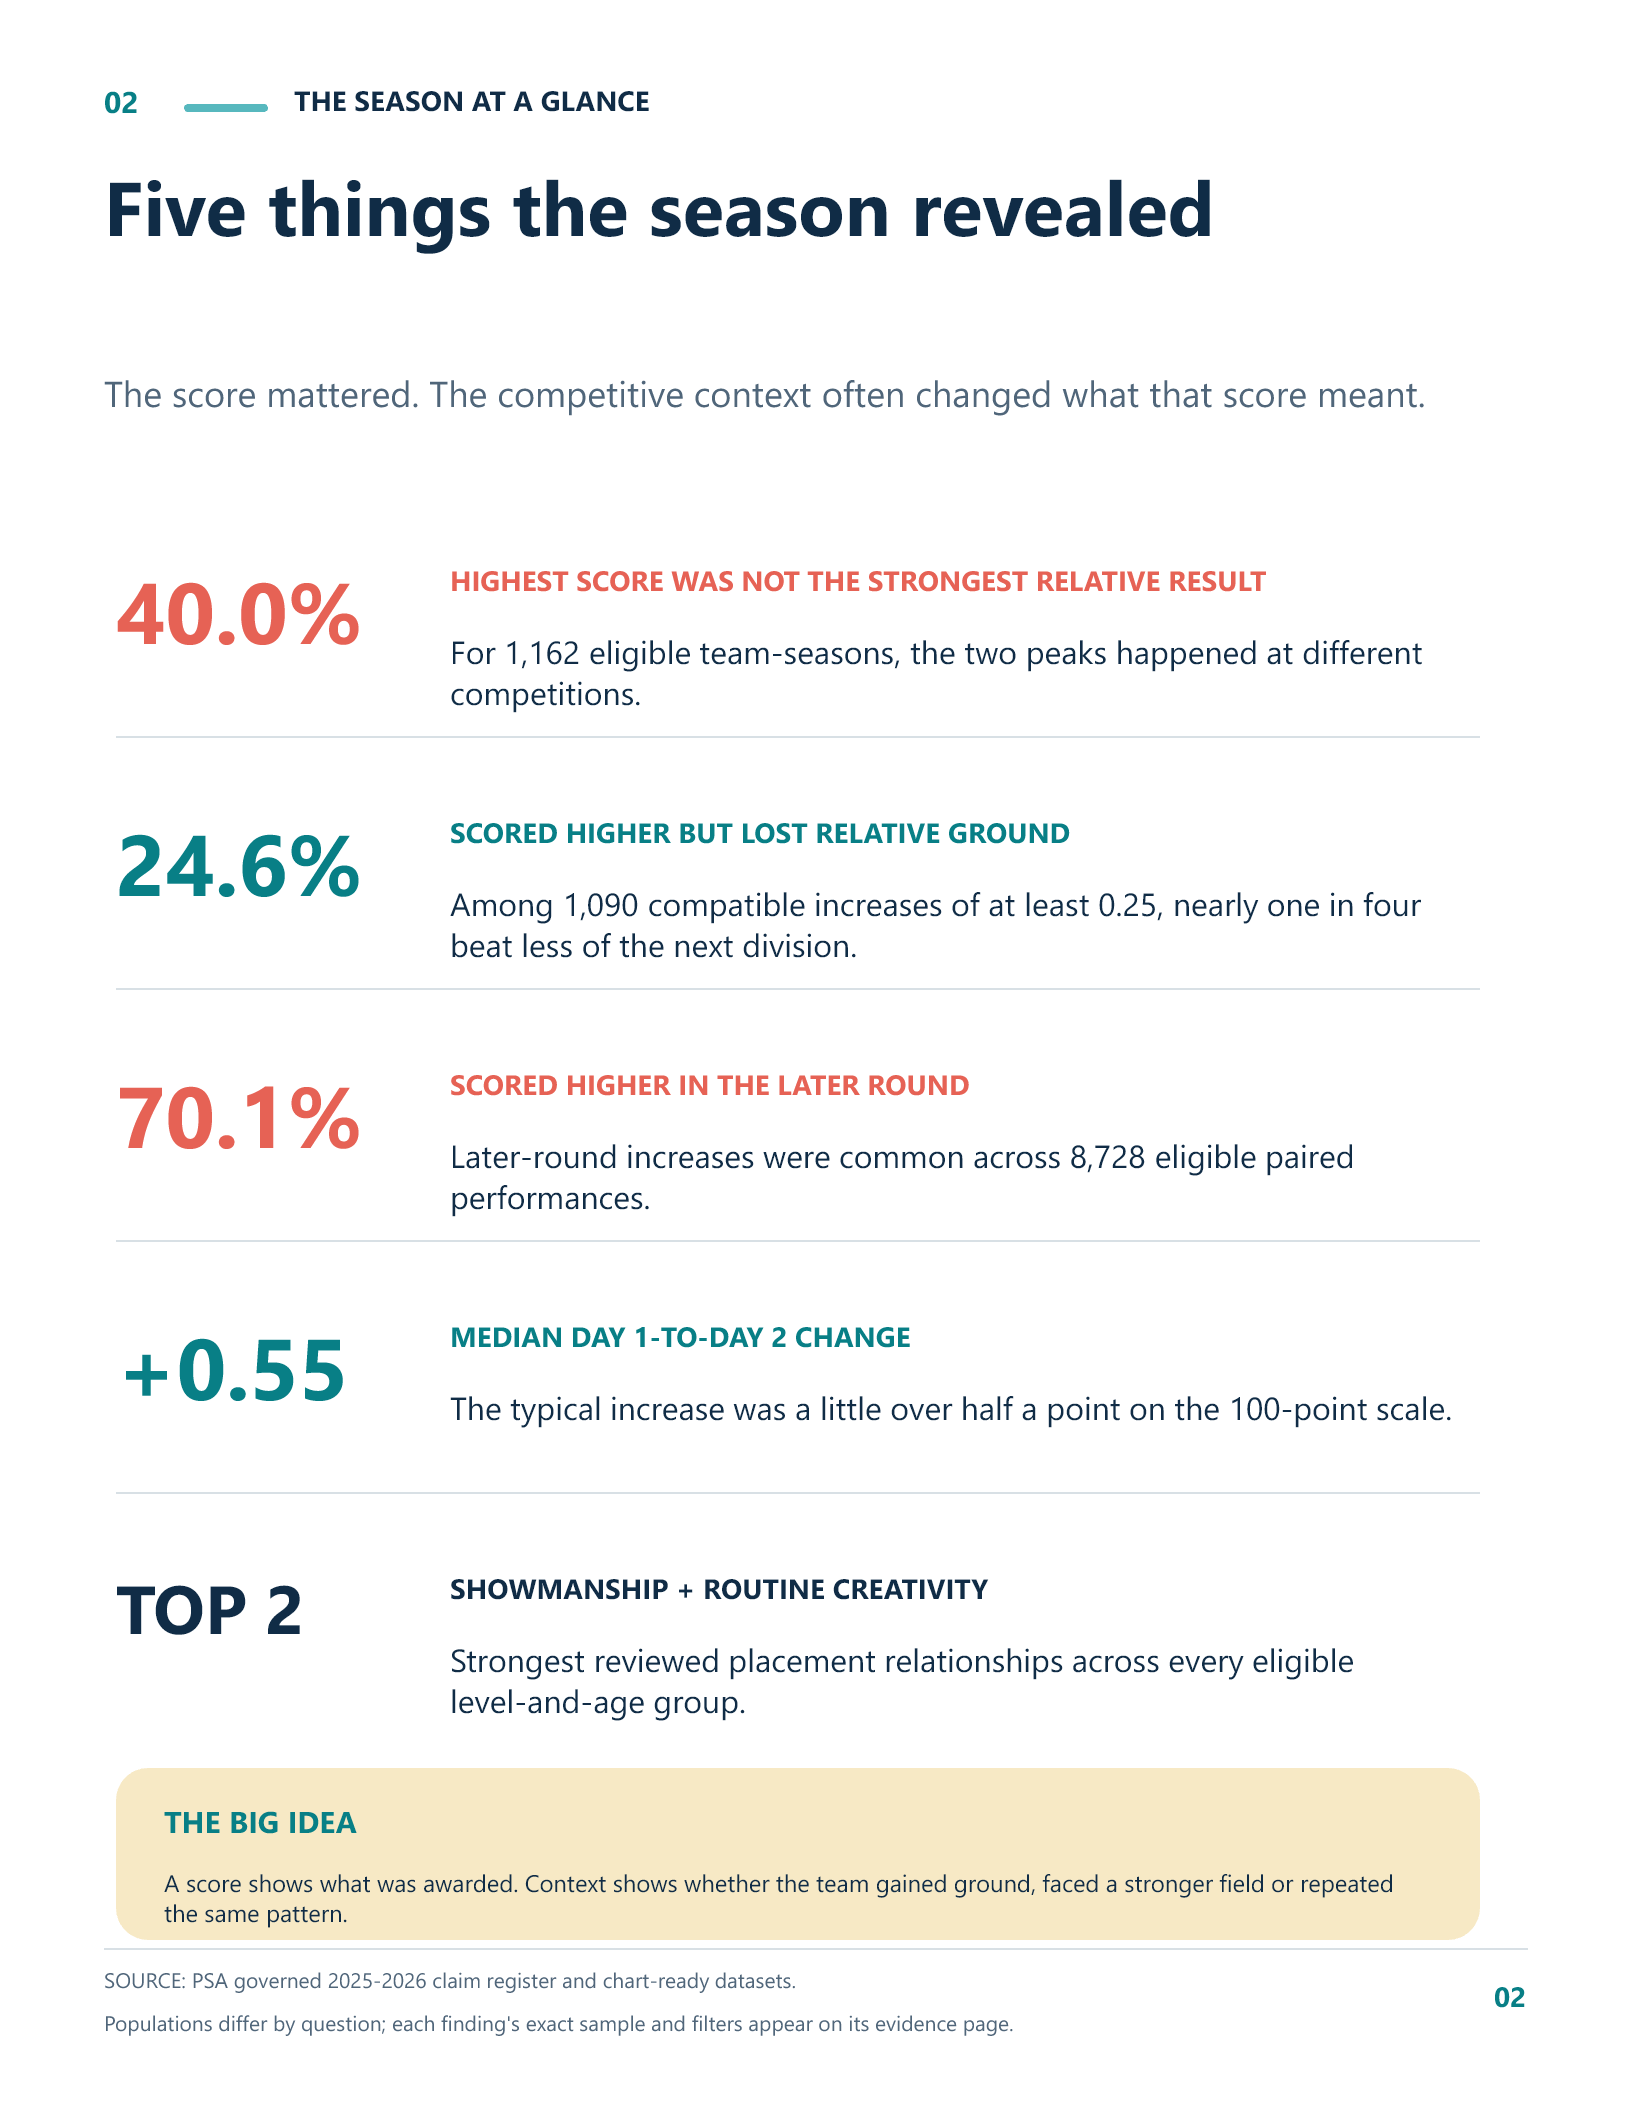
Three findings worth a second look
For 1,162 of 2,904 eligible Elite team-seasons, the two peaks occurred at different competitions.
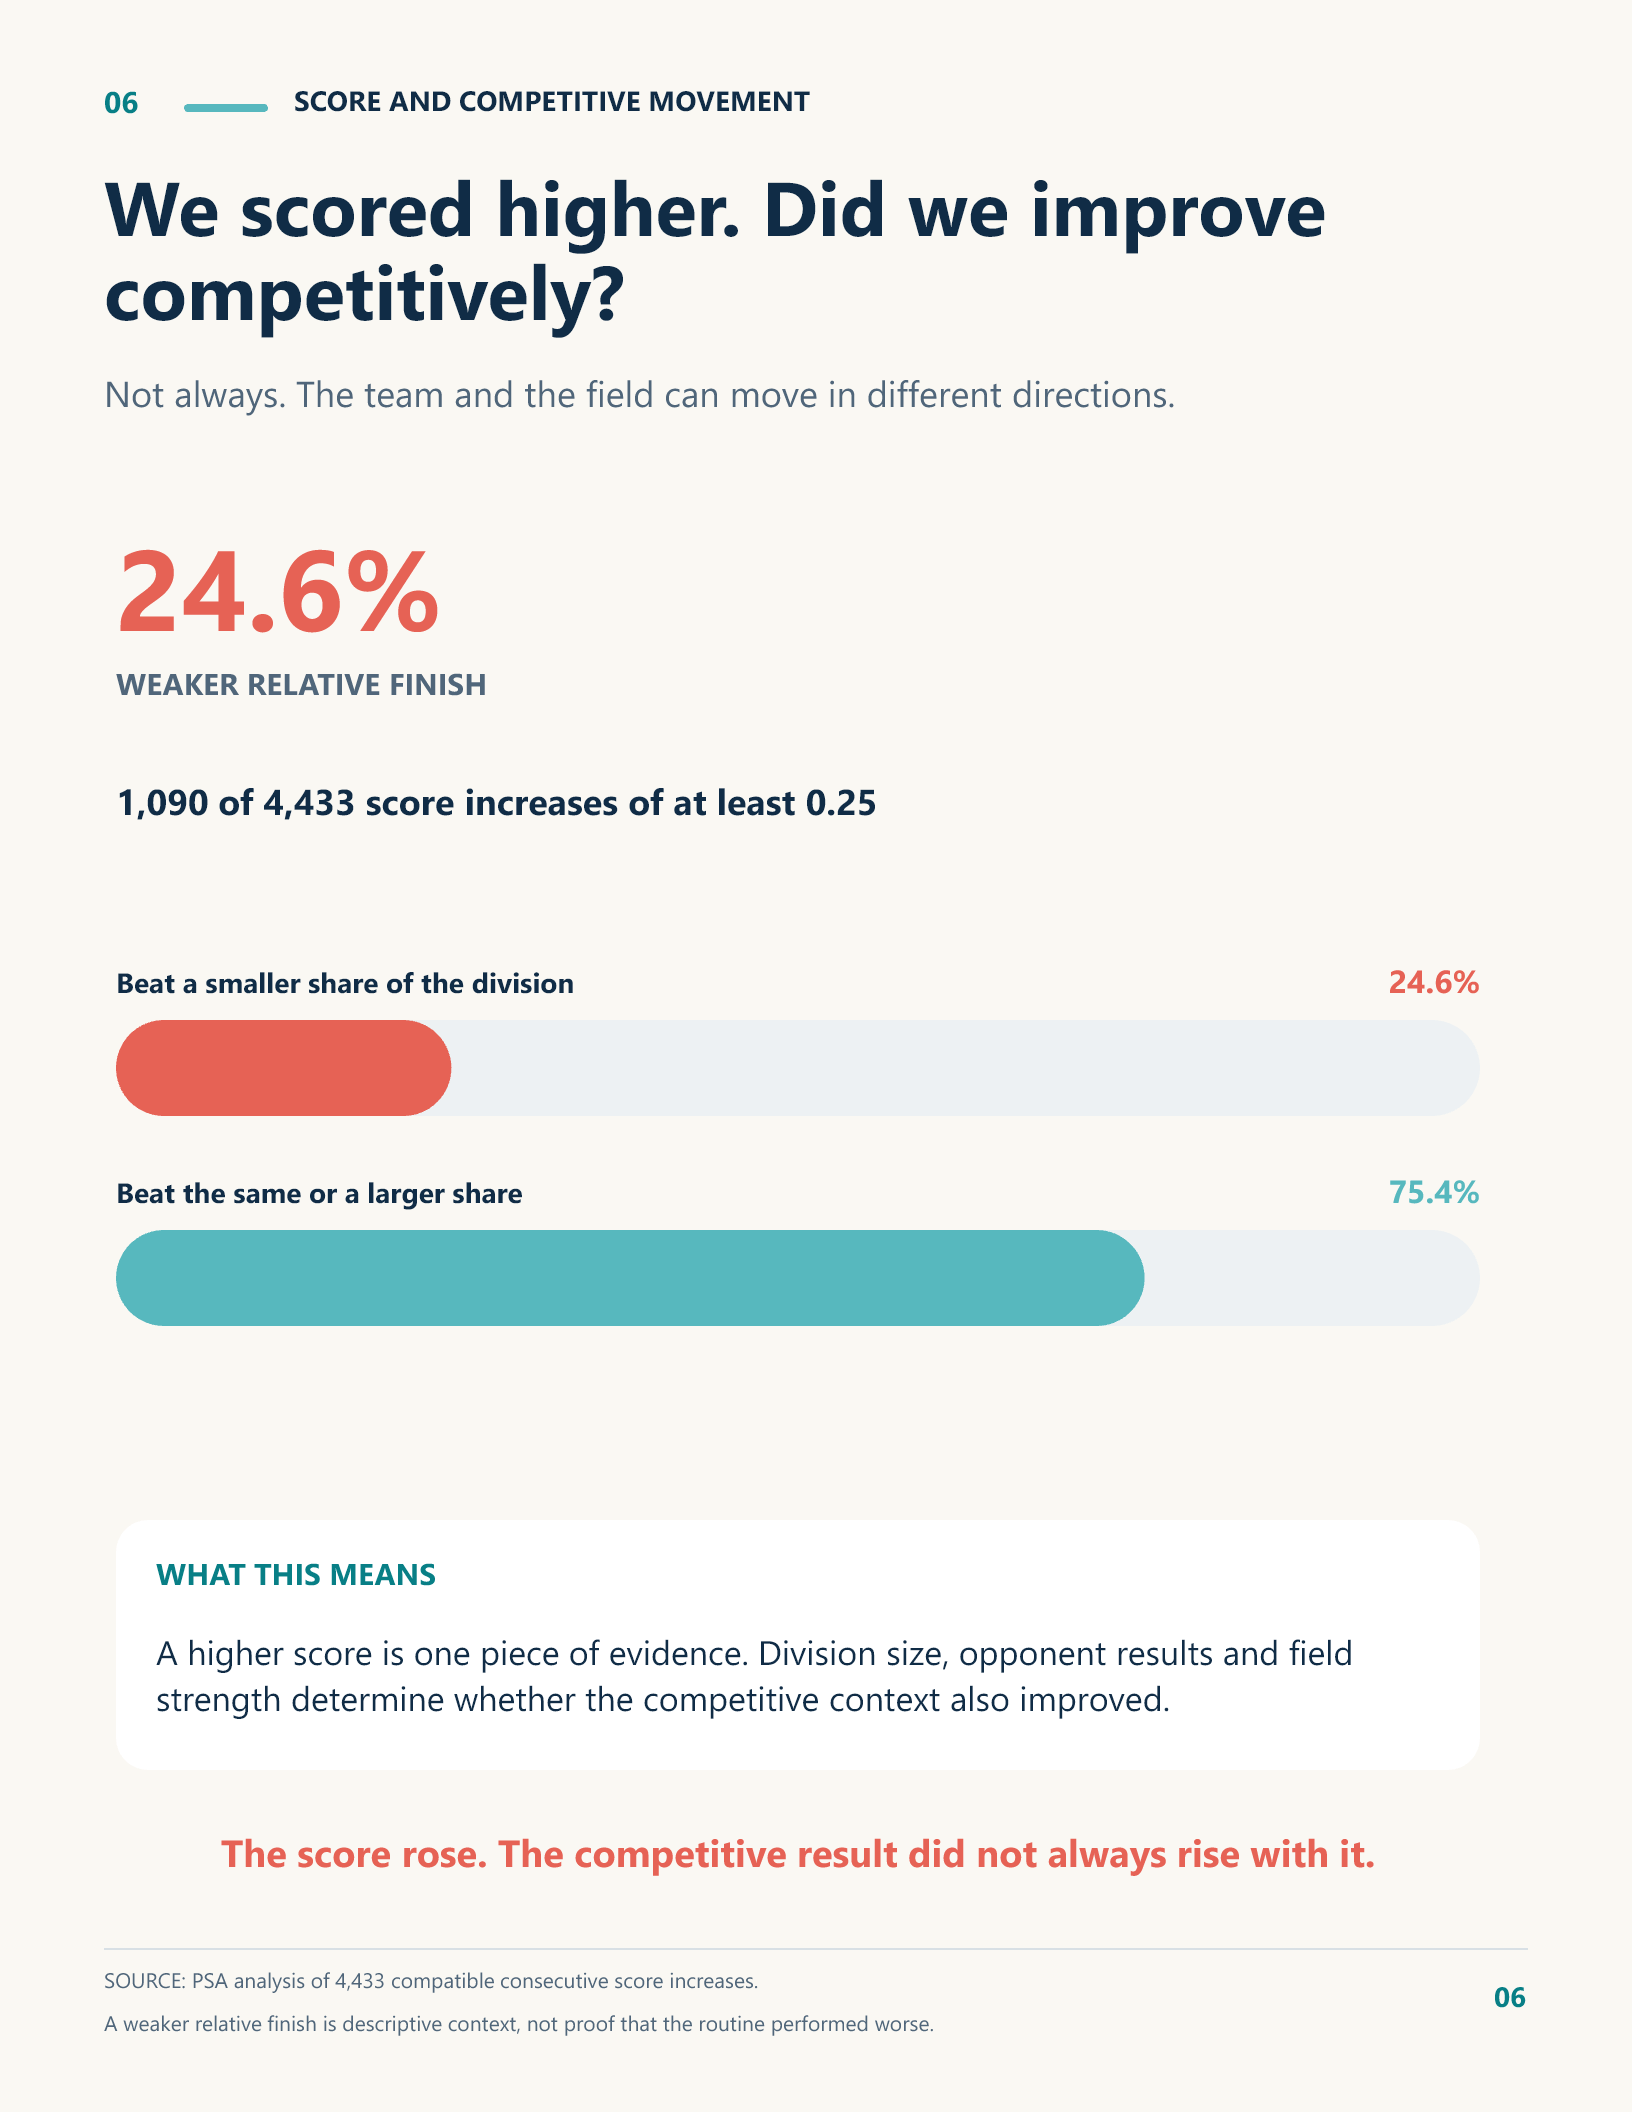
Among 4,329 compatible increases of at least 0.25, nearly one in four beat less of the next division.
Later-round increases occurred across 1,090 of 4,433 eligible paired Elite performances.
Inside the publication
Get the free report
Enter your email to access the report download. Submitting this form does not subscribe you to ongoing emails.
The Team Season Analysis connects your competition results to show how the season moved, which patterns repeated, and what your staff should review first.
$150 per teamPersonalized PDF + 30-minute coach review